Data, data quality, and data profiling
Data are an organization’s most valuable asset. However, too much data are inaccurate, incomplete, irrelevant, obsolete, not well defined, or otherwise not fit for use. Bad quality data can lead to operational inefficiencies, poor decision making, non-compliance issues, and lost revenue.
According to Gartner’s research, the average financial impact of bad data quality on organizations is $9.7 million per year. Hence, it is imperative for organizations to manage their data efficiently, and ensure that their data are of high quality.
Data profiling is about discovering and thoroughly reviewing the underlying data available to ascertain the characteristics, the data patterns, and essential statistics about the data1. It is essentially the first step in climbing the ladder of data quality, and it provides a proactive approach to understanding an organization’s data. In this article, we discuss the different data profiling methodologies that can be used to assess the quality of data in an organization.
Data profiling methodologies
Organizations can use one of following methods for examining the quality of their data assets, depending on the number of data elements or fields in the data set and the volume of data2.
• Manual data profiling
• Data profiling using spreadsheets
• Data profiling using programming languages like SQL, R, and Python
• Use of a data profiling tool
Manual data profiling
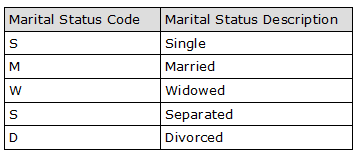
The old-fashioned way of solving data quality problems with source data was to engage a team of database professionals to manually analyze the data and unearth any issues. This is a feasible approach if the data set is small—that is, if it has very few columns and rows3. For example, the marital status data set in Figure 1 has two columns and five rows that can easily be manually analyzed for errors.
Figure 1: Marital status data set
However, if a data set were to have three columns and 200 rows, manual analysis would be tedious and prone to errors. Organizations typically have a large number of data repositories and databases with numerous tables and huge volumes of data. Manual data profiling is not a feasible option for such large data sets.
Data profiling using spreadsheets
Another way of conducting data profiling is to analyze the data using spreadsheets. Excel formulas (for example, COUNT, SUM, COUNTIF, SUM, VLOOKUP), pivot tables, and macros are typically used for data analysis.
However, this methodology is feasible only if a few data elements need analysis. For example, a data set containing three columns and 200 rows can be easily analyzed using a spreadsheet. However, like manual data profiling, this approach is not practical with today’s large databases.
Data profiling using programming languages
The following programming languages can be used perform data analysis with large data sets:
• Structured Query Language (SQL)
• R
• Python
Source data can be understood by writing SQL queries against data stored in tables in databases and/or using statistical programming languages like Python and R. These programming languages can help in performing analyses in ways that no spreadsheet can.
The ability to write codes in Python and R languages ensures you can analyze and visualize large data sets more efficiently. Data analysts use R specifically for statistical data analysis, and Python for a more general approach to data analytics. As both the languages are open source, learning any of them can increase your employability and get you hired fast.
Use of a data profiling tool
Manual data profiling, spreadsheets, and profiling using a programming language are dependent on a combination of documentation and individual knowledge, and are focused on selected aspects of a data source. However, these approaches are often time consuming and incomplete, as analysis tends to be concentrated in known areas of the data. Also, data sets have grown in size and complexity to the point where human analysis is not enough.
Data profiling tools comprise a new category of software that offers a fast, accurate, and automated way to understand data. Data profiling tools can analyze data from multiple data sources and have built-in capabilities to detect data anomalies, and hence are not limited to known areas of data only. There are several open-source and paid data profiling tools that can help businesses manage their data better. Available open-source data profiling tools include Talend Open Studio and Quadient DataCleaner. Those tools are free, but they also have paid versions with advanced functionalities.
Other vendor data profiling tools that can be purchased include IDQ Analyzer by Informatica and InfoSphere Information Analyzer by IBM.
Conclusion
Data profiling is the first step toward managing data quality. Typically, organizations have large amounts of data stored in different systems, and these systems have data stored in files or tables that have a multitude of data elements. However, profiling all this data is financially unfeasible and not necessary. Some data elements are critical, and organizations must profile these data, assess their quality, and ensure that they are fit for their intended uses.
Future articles will focus on simple SQL functions and example queries that can help you with profiling table data.
To learn more about data quality, including how to measure data quality dimensions, data profiling, implementing methodologies for data quality management, data quality strategy, and data quality aspects to consider when undertaking data intensive projects, read Data Quality: Dimensions, Measurement, Strategy, Management and Governance (ASQ Quality Press, 2019). This article draws significantly from that book’s research.
Note: This article was first published on QualityDigest.com in February 8 2023.
References
1. Mahanti, Rupa. “Critical Success Factors for Implementing Data Profiling: The First Step Toward Data Quality.” Software Quality Professional, 2014, vol.16, no. 2, pp. 13–26.
2. Mahanti, Rupa. “Data Profiling Project Selection and Implementation: The Key Considerations.” Software Quality Professional, 2015, vol. 17, no. 4, pp. 44–52.
3. Mahanti, Rupa. Data Quality: Dimensions, Measurement, Strategy, Management and Governance. ASQ Quality Press, 2019, p. 526.
Biography: Rupa Mahanti is a consultant, researcher, speaker, data enthusiast, and author of several books on data (data quality, data governance, and data analytics). You can connect with Rupa on LinkedIn or Research Gate (Research Gate has most of her published work, some of which can be downloaded for free) or Medium.


Great way of presenting the concepts from the easier more rudimental approach to more complex things.
Looking forward for future posts
Thanks Bruno. Glad you liked it!